
How to deploy a Google Cloud Dataflow
This guide will provide step-by-step instructions on how to deploy a Google Cloud Dataflow streaming pipeline that enables you to view Fabric Observability Metrics. You can use the following POST fabric/v4/streams//subscriptions request to create a Google Pub/Sub Subscription:
curl -X POST 'https://api.equinix.com/fabric/v4/streams/<streamId>/subscriptions' \
-H 'Content-Type: application/json' \
-H 'Authorization: Bearer <Bearer Token>' \
-d '{
    "type": "STREAM_SUBSCRIPTION",
    "name": "<gcp_pubsub_subscription_name>",
    "description": "<gcp_pubsub_subscription_desc>",
    "sink": {
      "uri": "https://pubsub.googleapis.com/v1/projects/<gcp_project_name>/topics/<gcp_topic_name>:publish",
      "type": "GOOGLE_PUBSUB",
      "credential": {
        "type": "ACCESS_TOKEN",
        "accessToken": "<encoded_base64_service_account_json>"
      }
    }
  }'
Step-by-Step Instructions
1. GCP Prerequisites Set Up
Note: This guide uses gcloud CLI for set up. Refer to Google Cloud Docs for gcloud CLI installation: https://cloud.google.com/sdk/docs/install. Additionally, GCP will incur its own costs for running the Dataflow Pipeline outside of any costs fort Equinix Observability.
- Select or create a project
- Ensure that billing is enabled
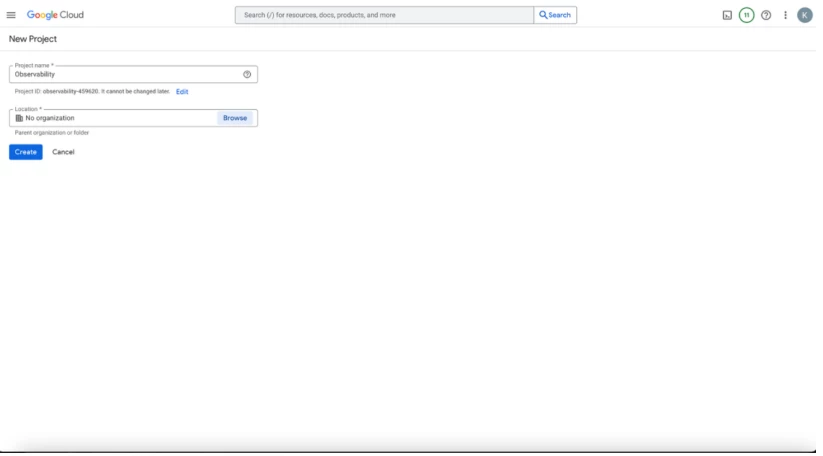
1.1 Create or select a GCP Project
- Click the project selector.
- Click new project or select an existing project.
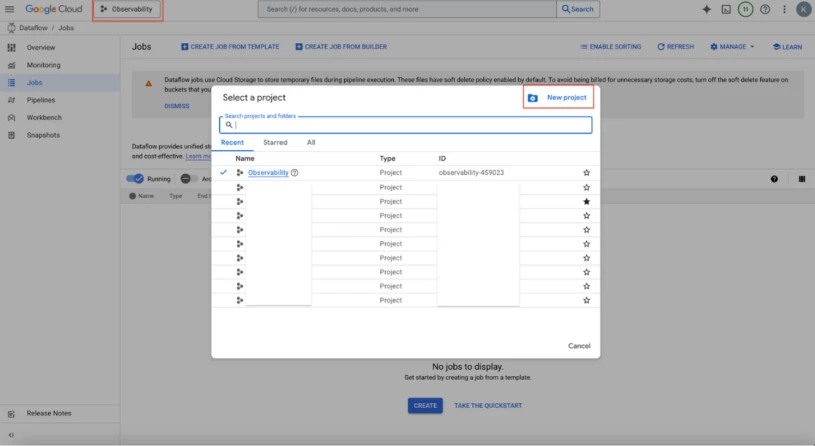
- GCP Project Name: Enter a project name.
- Click create to continue.
1.2 Set your GCP Project in gcloud
- Set your project id in gcloud by replacing YOUR_PROJECT_ID with your actual GCP Project ID:
Bash
gcloud config set project YOUR_PROJECT_ID
1.3 Enable APIs in GCP Project
- Enable all necessary APIs in your Project:
Bash
gcloud services enable \
pubsub.googleapis.com \
dataflow.googleapis.com \
monitoring.googleapis.com \
compute.googleapis.com \
storage.googleapis.com \
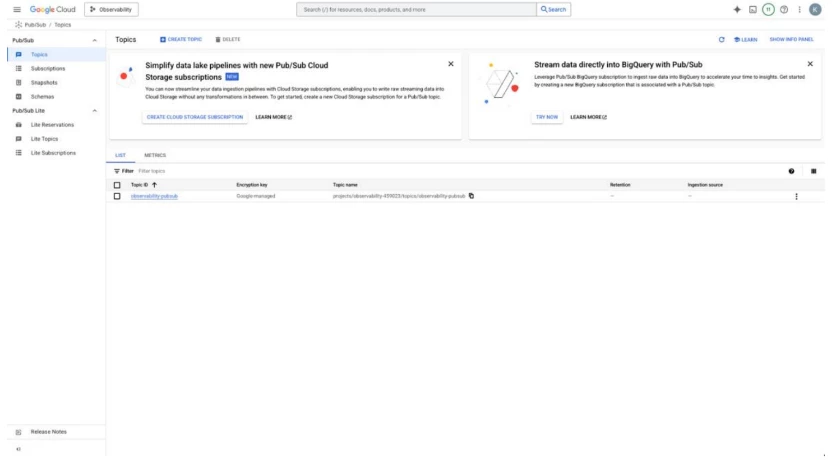
cloudresourcemanager.googleapis.com2. Create Pub/Sub Topic
- Create the Pub/Sub Topic that will receive the Equinix Metric Messages being streamed to.
- Set your YOUR_TOPIC_ID with actual desired Pub/Sub Name.
Bash
export PROJECT_ID=$(gcloud config get-value project) # Run if not already set
export TOPIC_ID="YOUR_TOPIC_ID"
gcloud pubsub topics create ${TOPIC_ID} --project ${PROJECT_ID}- Verify Pub/Sub Topic created in the GCP Portal.
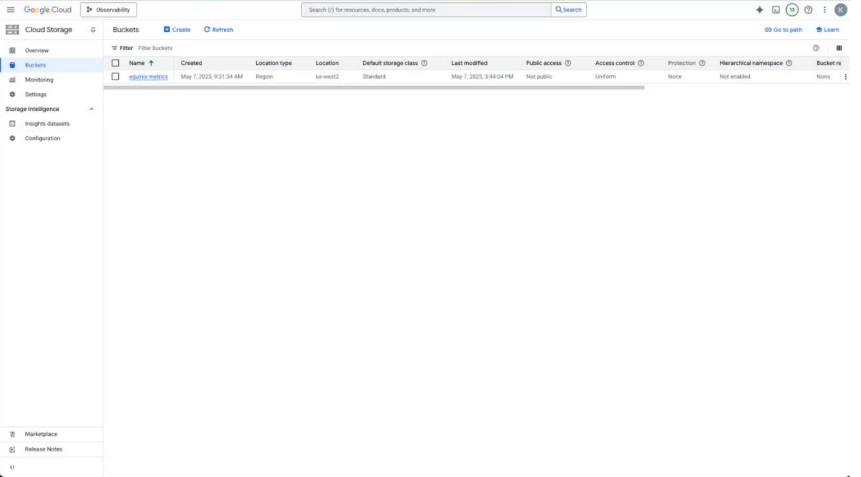
3. Create Google Cloud Storage (GCS Bucket
- The dataflow Bucket creates a temporary storage for staging temporary files.
- Set your BUCKET_NAME with the actual desired bucket name.
- Set your GCS Region to your actual desired region for the bucket.
Bash
export PROJECT_ID=$(gcloud config get-value project) # Run if not already set
export BUCKET_NAME="equinix-metrics" # Or your preferred bucket name
export GCS_REGION="us-west2" # Or your preferred region for the bucket
gsutil mb -p ${PROJECT_ID} -l ${GCS_REGION} gs://${BUCKET_NAME}
Note for Optimal Cost Optimization: For this transient data bucket, you might considered disabling soft delete to reduce storage costs.
Bash
gcloud storage buckets update --clear-soft-delete gs://${BUCKET_NAME}
# Or gsutil retention soft-delete set off gs://${BUCKET_NAME}- Verify GCS Bucket created in the GCP Portal.
4. Define Custom Metric Descriptors for Cloud Monitoring
- Create the following JSON files definitions that tell Cloud Monitoring about the structure, units, and labels of the Custom Equinix Metrics.
- Note: All of these metrics JSON files are optional depending on which metric you are interested in.
4.1 Create Port Metrics JSON Files
- metric_port_rx_bps_descriptor.json
{
"type": "custom.googleapis.com/equinix/fabric/port/port_bandwidth_rx_bps",
"metricKind": "GAUGE",
"valueType": "DOUBLE",
"unit": "bit/s",
"description": "Equinix Fabric Port received bandwidth usage in bits per second.",
"displayName": "Equinix Fabric Port RX Bandwidth bps",
"labels": [
{ "key": "port_uuid", "valueType": "STRING", "description": "Equinix Fabric Port UUID." }
]
}- metric_port_tx_bps_descriptor.json
{
"type": "custom.googleapis.com/equinix/fabric/port/port_bandwidth_tx_bps",
"metricKind": "GAUGE",
"valueType": "DOUBLE",
"unit": "bit/s",
"description": "Equinix Fabric Port transmitted bandwidth usage in bits per second.",
"displayName": "Equinix Fabric Port TX Bandwidth bps",
"labels": [
{ "key": "port_uuid", "valueType": "STRING", "description": "Equinix Fabric Port UUID." }
]
}- metric_port_rx_mibps_descriptor.json
{
"type": "custom.googleapis.com/equinix/fabric/port/port_bandwidth_rx_mibps",
"metricKind": "GAUGE",
"valueType": "DOUBLE",
"unit": "Mibyte/s",
"description": "Equinix Fabric port received bandwidth usage in Mebibytes per second.",
"displayName": "Equinix Fabric Port RX Bandwidth MiBps",
"labels": [
{ "key": "port_uuid", "valueType": "STRING", "description": "Equinix Fabric Port UUID." }
]
}- metric_port_tx_mibps_descriptor.json
{
"type": "custom.googleapis.com/equinix/fabric/port/port_bandwidth_tx_mibps",
"metricKind": "GAUGE",
"valueType": "DOUBLE",
"unit": "Mibyte/s",
"description": "Equinix Fabric port transmitted bandwidth usage in Mebibytes per second.",
"displayName": "Equinix Fabric Port TX Bandwidth MiBps",
"labels": [
{ "key": "port_uuid", "valueType": "STRING", "description": "Equinix Fabric Port UUID." }
]
}- metric_port_rx_packets_dropped_exceeded_count_descriptor.json
{
"type": "custom.googleapis.com/equinix/fabric/port/port_packets_dropped_rx_rateexceeded_count",
"metricKind": "GAUGE",
"valueType": "INT64",
"unit": "{count}",
"description": "Equinix Fabric port count of received packets dropped due to rate exceeded.",
"displayName": "Equinix Fabric Port RX Packet Drops",
"labels": [
{ "key": "port_uuid", "valueType": "STRING", "description": "Equinix Fabric Port UUID." }
]
}- metric_port_rx_packets_erred_count_descriptor.json
{
"type": "custom.googleapis.com/equinix/fabric/port/port_packets_erred_rx_count",
"metricKind": "GAUGE",
"valueType": "INT64",
"unit": "{count}",
"description": "Equinix Fabric port count of received packets errored.",
"displayName": "Equinix Fabric Port RX Packet Errored",
"labels": [
{ "key": "port_uuid", "valueType": "STRING", "description": "Equinix Fabric Port UUID." }
]
}- metric_port_tx_packets_erred_count_descriptor.json
{
"type": "custom.googleapis.com/equinix/fabric/port/port_packets_erred_tx_count",
"metricKind": "GAUGE",
"valueType": "INT64",
"unit": "{count}",
"description": "Equinix Fabric port count of transmitted packets errored.",
"displayName": "Equinix Fabric Port TX Packet Errored",
"labels": [
{ "key": "port_uuid", "valueType": "STRING", "description": "Equinix Fabric Port UUID." }
]
}
4.2 Create Connection Metrics Json Files
- metric_connection_rx_bps_descriptor.json
{
"type": "custom.googleapis.com/equinix/fabric/connection/connection_bandwidth_rx_bps",
"metricKind": "GAUGE",
"valueType": "DOUBLE",
"unit": "bit/s",
"description": "Equinix Fabric connection received bandwidth usage in bits per second.",
"displayName": "Equinix Fabric Connection RX Bandwidth bps",
"labels": [
{ "key": "connection_uuid", "valueType": "STRING", "description": "Equinix Fabric Connection
UUID." }
]
}- metric_connection_tx_bps_descriptor.json
{
"type": "custom.googleapis.com/equinix/fabric/connection/connection_bbandwidth_tx_bps",
"metricKind": "GAUGE",
"valueType": "DOUBLE",
"unit": "bit/s",
"description": "Equinix Fabric connection transmitted bandwidth usage in bits per second.",
"displayName": "Equinix Fabric Connection TX Bandwidth bps",
"labels": [
{ "key": "connection_uuid", "valueType": "STRING", "description": "Equinix Fabric Connection
UUID." }
]
}- metric_connection_rx_mibps_descriptor.json
{
"type": "custom.googleapis.com/equinix/fabric/connection/connection_bandwidth_rx_mibps",
"metricKind": "GAUGE",
"valueType": "DOUBLE",
"unit": "Mibyte/s",
"description": "Equinix Fabric connection received bandwidth usage in Mebibytes per second.",
"displayName": "Equinix Fabric Connection RX Bandwidth MiBps",
"labels": [
{ "key": "connection_uuid", "valueType": "STRING", "description": "Equinix Fabric Connection
UUID." }
]
}- metric_connection_tx_mibps_descriptor.json
{
"type": "custom.googleapis.com/equinix/fabric/connection/connection_bandwidth_tx_mibps",
"metricKind": "GAUGE",
"valueType": "DOUBLE",
"unit": "Mibyte/s",
"description": "Equinix Fabric connection transmitted bandwidth usage in Mebibytes per second.",
"displayName": "Equinix Fabric Connection TX Bandwidth MiBps",
"labels": [
{ "key": "connection_uuid", "valueType": "STRING", "description": "Equinix Fabric Connection
UUID." }
]
}- metric_connection_rx_adrops_descriptor.json
{
"type":
"custom.googleapis.com/equinix/fabric/connection/connection_packets_dropped_rx_aside_rateexceeded_co
unt",
"metricKind": "GAUGE",
"valueType": "INT64",
"unit": "{count}",
"description": "Equinix Fabric connection count of received packets dropped due to rate exceeded
(A-Side).",
"displayName": "Equinix Fabric Connection RX Packet Drops A-Side",
"labels": [
{ "key": "connection_uuid", "valueType": "STRING", "description": "Equinix Fabric Connection
UUID." }
]
}- metric_connection_tx_adrops_descriptor.json
{
"type":
"custom.googleapis.com/equinix/fabric/connection/connection_packets_dropped_tx_aside_rateexceeded_co
unt",
"metricKind": "GAUGE",
"valueType": "INT64",
"unit": "{count}",
"description": "Equinix Fabric connection count of transmitted packets dropped due to rate
exceeded (A-Side).",
"displayName": "Equinix Fabric Connection TX Packet Drops A-Side",
Equinix.com © 2024 Equinix, Inc.
12
Integrating Datadog as a Data Collector
"labels": [
{ "key": "connection_uuid", "valueType": "STRING", "description": "Equinix Fabric Connection
UUID." }
]
}- metric_connection_rx_zdrops_descriptor.json
{
"type":
"custom.googleapis.com/equinix/fabric/connection/connection_packets_dropped_rx_zside_rateexceeded_co
unt",
"metricKind": "GAUGE",
"valueType": "INT64",
"unit": "{count}",
"description": "Equinix Fabric connection count of received packets dropped due to rate exceeded
(Z-Side).",
"displayName": "Equinix Fabric Connection RX Packet Drops Z-Side",
"labels": [
{ "key": "connection_uuid", "valueType": "STRING", "description": "Equinix Fabric Connection
UUID." }
]
}- metric_connection_tx_zdrops_descriptor.json
{
"type":
"custom.googleapis.com/equinix/fabric/connection/connection_packets_dropped_tx_zside_rateexceeded_co
unt",
"metricKind": "GAUGE",
"valueType": "INT64",
"unit": "{count}",
"description": "Equinix Fabric connection count of transmitted packets dropped due to rate
exceeded (Z-Side).",
"displayName": "Equinix Fabric Connection TX Packet Drops Z-Side",
"labels": [
{ "key": "connection_uuid", "valueType": "STRING", "description": "Equinix Fabric Connection
UUID." }
]
}
4.3 Create Metro Latency Metrics Json Files
- metric_latency_descriptor.json
{
"type": "custom.googleapis.com/equinix/fabric/metro/latency",
"metricKind": "GAUGE",
"valueType": "DOUBLE",
"unit": "ms",
"description": "Equinix Fabric inter-metro latency in milliseconds.",
"displayName": "Equinix Fabric Metro Latency",
"labels": [
{ "key": "source_metro", "valueType": "STRING", "description": "Source Metro Code (e.g., SV)."
},
{ "key": "destination_metro", "valueType": "STRING", "description": "Destination Metro Code
(e.g., AM)." }
]
}
4.4 Create Custom Metrics Json Descriptors using REST API
- Run comments to create Google custom metrics
Bash
export PROJECT_ID=$(gcloud config get-value project) # Run if not already set
export ACCESS_TOKEN=$(gcloud auth print-access-token)
JSON_FILES=(
"metric_port_rx_bps_descriptor.json"
"metric_port_tx_bps_descriptor.json"
"metric_port_rx_mibps_descriptor.json"
"metric_port_tx_mibps_descriptor.json"
"metric_port_rx_packets_dropped_exceeded_count_descriptor.json"
"metric_port_tx_packets_dropped_exceeded_count_descriptor.json"
"metric_port_rx_packets_erred_count_descriptor.json"
"metric_port_tx_packets_erred_count_descriptor.json"
"metric_connection_rx_bps_descriptor.json"
"metric_connection_tx_bps_descriptor.json"
"metric_connection_rx_mibps_descriptor.json"
"metric_connection_tx_mibps_descriptor.json"
"metric_connection_rx_adrops_descriptor.json"
"metric_connection_tx_adrops_descriptor.json"
"metric_connection_rx_zdrops_descriptor.json"
"metric_connection_tx_zdrops_descriptor.json"
"metric_latency_descriptor.json"
)# Run these commands once per project. If a descriptor already exists, the API will return an error,
which is fine.
for json_file in "${JSON_FILES[@]}"; do
if [ -f "$json_file" ]; then
echo "Creating metric descriptor from $json_file..."
curl -X POST \
"https://monitoring.googleapis.com/v3/projects/${PROJECT_ID}/metricDescriptors" \
-H "Authorization: Bearer ${ACCESS_TOKEN}" \
-H "Content-Type: application/json" \
-d @"$json_file"
echo # Newline for readability
else
echo "Warning: JSON file $json_file not found. Skipping."
fi
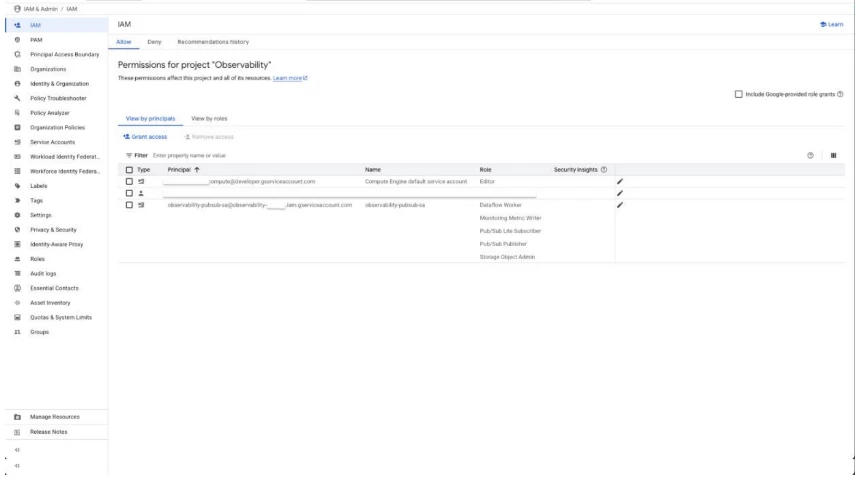
done5. Grant IAM Permissions for the Service Account
- Create a service account or use existing service account in your project.
- The Project's Service Account is usually - compute@developer.gserviceaccount.com.
- If you created a new service account, the Project's Service is account is @<-YOUR_PROJECT_ID>.iam.gserviceaccount.com
- Grant the following roles in your project's service account:
- Pub/Sub Subscriber (roles/pubsub/subscriber)
- Monitoring Metric Writer (roles/monitoring.metricwriter)
- Storage Object Admin (roles/storage.objectAdmin)
- Dataflow Worker (roles/dataflow/worker)
Bash
export PROJECT_ID=$(gcloud config get-value project) # Run if not already set
# Use service account name for default project’s service account
export PROJECT_NUMBER=$(gcloud projects describe ${PROJECT_ID} --
format='value(projectNumber)')
export DF_WORKER_SA="${PROJECT_NUMBER}-
compute@developer.gserviceaccount.com"
# Use service account name if newly created
# Replace YOUR_SERVICE_ACCOUNT_NAME with your desired name
export SA_NAME="YOUR_SERVICE_ACCOUNT_NAME"
export DF_WORKER_SA="${SA_NAME}"@${PROJECT_ID}.iam.gserviceaccount.com"
gcloud projects add-iam-policy-binding ${PROJECT_ID} --
member="serviceAccount:${DF_WORKER_SA}" --role="roles/pubsub.subscriber"
gcloud projects add-iam-policy-binding ${PROJECT_ID} --
member="serviceAccount:${DF_WORKER_SA}" --role="roles/monitoring.metricWriter"
gcloud projects add-iam-policy-binding ${PROJECT_ID} --
member="serviceAccount:${DF_WORKER_SA}" --role="roles/dataflow.worker"
# Grant Storage Admin on the specific bucket
gsutil iam ch serviceAccount:${DF_WORKER_SA}:objectAdmin
gs://${BUCKET_NAME} # Use BUCKET_NAME from step 3- Verify IAM Permissions for the service account created in the GCP Portal.
6. Parse Pub/Sub Data with Python Script
- Create a python script below to parse the Google Pub/Sub Messages sent from Equinix Observability for streaming and displaying in Google Cloud Monitoring.
6.1 Set up Python Environment
- Create a directory if you have not already.
- Recommended to use a Python Virtual Environment (venv):
Bash
python3 -m venv env_equinix_df
source env_equinix_df/bin/activate # (Linux/macOS)
# For Windows: .\env_equinix_df\Scripts\activate- Install the required libraries:
Bash
pip install --upgrade pip
pip install apache-beam[gcp] google-cloud-monitoring- Create file requirements.txt
# requirements.txt
apache-beam[gcp]
google-cloud-monitoring
6.2 Create Python Script File
- Create file pubsub_to_equinix_metrics.py
import argparse
import logging
import json
from datetime import datetime, timezone
import math
import re
import apache_beam as beam
from apache_beam.options.pipeline_options import PipelineOptions
from apache_beam.utils.timestamp import Timestamp as BeamTimestamp
from google.cloud import monitoring_v3
from google.api_core.exceptions import GoogleAPICallError
from google.protobuf import timestamp_pb2
from google.cloud.monitoring_v3.types import TimeInterval
# --- Constants ---
METRIC_TYPE_BASE = "custom.googleapis.com/equinix/fabric"
BITS_TO_MEBIBYTES = 8388608.0 # 1024 * 1024 * 8
LATENCY_NAME_REGEX = re.compile(r"equinix\.fabric\.metro\.([a-z0-9]{2})_([a-z0-9]{2})\.latency")
METRIC_TYPES = {
"port_bw_rx_bps": f"{METRIC_TYPE_BASE}/port/port_bandwidth_rx_bps",
"port_bw_tx_bps": f"{METRIC_TYPE_BASE}/port/port_bandwidth_tx_bps",
"port_bw_rx_mibps": f"{METRIC_TYPE_BASE}/port/port_bandwidth_rx_mibps",
"port_bw_tx_mibps": f"{METRIC_TYPE_BASE}/port/port_bandwidth_tx_mibps",
"port_drop_rx": f"{METRIC_TYPE_BASE}/port/port_packets_dropped_rx_rateexceeded_count",
"port_drop_tx": f"{METRIC_TYPE_BASE}/port/port_packets_dropped_tx_rateexceeded_count",
"port_erred_rx": f"{METRIC_TYPE_BASE}/port/port_packets_erred_rx_count",
"port_erred_tx": f"{METRIC_TYPE_BASE}/port/port_packets_erred_tx_count",
"connection_bw_rx_bps": f"{METRIC_TYPE_BASE}/connection/connection_bandwidth_rx_bps",
"connection_bw_tx_bps": f"{METRIC_TYPE_BASE}/connection/connection_bandwidth_tx_bps",
"connection_bw_rx_mibps": f"{METRIC_TYPE_BASE}/connection/connection_bandwidth_rx_mibps",
"connection_bw_tx_mibps": f"{METRIC_TYPE_BASE}/connection/connection_bandwidth_tx_mibps",
"connection_drop_rx_a":
f"{METRIC_TYPE_BASE}/connection/connection_packets_dropped_rx_aside_rateexceeded_count",
"connection_drop_tx_a":
f"{METRIC_TYPE_BASE}/connection/connection_packets_dropped_tx_aside_rateexceeded_count",
"connection_drop_rx_z":
f"{METRIC_TYPE_BASE}/connection/connection_packets_dropped_rx_zside_rateexceeded_count",
"connection_drop_tx_z":
f"{METRIC_TYPE_BASE}/connection/connection_packets_dropped_tx_zside_rateexceeded_count",
"latency": f"{METRIC_TYPE_BASE}/metro/latency"
}
# --- Helper Functions & Classes ---
def parse_equinix_flat_message(message_bytes):
"""Parses the flat Equinix JSON format, returns dict or None."""
try:
message_str = message_bytes.decode('utf-8')
data = json.loads(message_str)
 logging.debug(f"Parser: Processing raw data keys: {list(data.keys())}")
required_keys = ['message', 'resource', 'metrics']
if not all(k in data for k in required_keys):
logging.debug(f"Parser: Skipping - Missing required keys from {required_keys}. Has:
{list(data.keys())}")
return None
resource = data.get('resource', [])
metrics = data.get('metrics', [])
time_str = metrics[0]['datapoints'][0].get('endDateTime')
beam_timestamp = None
if time_str:
try:
if time_str.endswith('Z'): time_str_adjusted = time_str[:-1] + '+00:00'
else: time_str_adjusted = time_str # Assume it might have offset already
event_dt_aware = datetime.fromisoformat(time_str_adjusted)
beam_timestamp = BeamTimestamp.from_utc_datetime(event_dt_aware)
except ValueError as e_iso:
try: # Fallback to "YYYY-MM-DD HH:MM:SS UTC"
dt_part = time_str.split(" UTC")[0]
event_dt = datetime.strptime(dt_part, "%Y-%m-%d %H:%M:%S")
event_dt_aware = event_dt.replace(tzinfo=timezone.utc)
beam_timestamp = BeamTimestamp.from_utc_datetime(event_dt_aware)
except (ValueError, IndexError) as e_old:
logging.error(f"Parser: Invalid timestamp '{time_str}'. Tried ISO & old. ISO
Error: {e_iso}. Old Error: {e_old}")
return None
else: logging.warning("Parser: Missing 'time' field."); return None
if beam_timestamp is None: logging.warning("Parser: Failed to parse timestamp."); return
None
subject_str = resource.get('href').split('/')[-1]; subject_id = "unknown"
if subject_str:
try:
subject_id = subject_str.split('/')[-1]
if not subject_id and len(subject_str.split('/')) > 1 : subject_id =
subject_str.split('/')[-2]
if not subject_id : subject_id = "unknown"
except Exception as e: logging.warning(f"Parser: Error extracting ID from subject
'{subject_str}': {e}"); subject_id = "unknown"
metric_value_str = metrics[0]['datapoints'][0].get('value'); metric_value_float = None
if metric_value_str is not None:
try: metric_value_float = float(metric_value_str)
except ValueError: logging.error(f"Parser: Invalid metric value '{metric_value_str}'");
return None
else: logging.warning("Parser: Missing 'metricvalue' field."); return None
parsed_data = {
'metricname': metrics[0].get('name'),
'metricvalue': metric_value_float,
'subject': subject_str,
'subject_id': subject_id,
'timestamp_obj': beam_timestamp,
}
logging.debug(f"Parser: Successfully parsed {parsed_data.get('metricname')}")
return parsed_data
except (json.JSONDecodeError, UnicodeDecodeError, TypeError) as e:
logging.debug(f"Parser: Skipping message - JSON or Type error: {e}")
return None
except Exception as e_gen:
logging.error(f"Parser: Unexpected error: {e_gen}", exc_info=True)
return None
class WriteMetricsDoFn(beam.DoFn):
"""Writes all handled Equinix metrics to Cloud Monitoring."""
def __init__(self, project_id):
self.project_id = project_id; self.monitoring_client = None
self.project_name = f"projects/{self.project_id}"
def setup(self):
try: self.monitoring_client = monitoring_v3.MetricServiceClient(); logging.info("Monitoring
client initialized.")
except Exception as e: logging.error(f"Failed to initialize Monitoring client: {e}",
exc_info=True); raise
def _write_metric_point(self, metric_type, value_kind, value, labels, time_interval):
try:
series = monitoring_v3.TimeSeries()
series.metric.type = metric_type
for key, val in labels.items(): series.metric.labels[key] = str(val)
series.resource.type = "global"; series.resource.labels["project_id"] = self.project_id
point = monitoring_v3.Point()
if value_kind == "DOUBLE": point.value.double_value = float(value)
elif value_kind == "INT64": point.value.int64_value = int(value)
else: logging.error(f"Writer Helper: Unknown value_kind '{value_kind}' for
{metric_type}"); return
point.interval = time_interval
series.points = [point]
self.monitoring_client.create_time_series(name=self.project_name, time_series=[series])
logging.info(f"Successfully wrote metric: {metric_type} Labels: {labels} Value:
{value}")
except GoogleAPICallError as e_api: logging.error(f"Writer Helper: API call failed for
{metric_type}: {e_api}", exc_info=False)
except Exception as e_write: logging.error(f"Writer Helper: Error writing metric
{metric_type}: {e_write}", exc_info=True)
def process(self, element):
if not self.monitoring_client: logging.error("Writer: Monitoring client not initialized.");
return
try:
metric_name_str = element.get('metricname')
metric_value = element.get('metricvalue') # Float
subject_id = element.get('subject_id', 'unknown')
event_timestamp = element.get('timestamp_obj')
if metric_value is None or event_timestamp is None or not metric_name_str:
logging.warning(f"Writer: Skipping element due to missing data: {element}")
return
time_interval = None
try:
event_dt_utc = event_timestamp.to_utc_datetime()
posix_timestamp_float = event_dt_utc.timestamp()
seconds_val = math.floor(posix_timestamp_float)
nanos_val = max(0, min(999999999, int((posix_timestamp_float - seconds_val) * 1e9)))
end_time_proto = timestamp_pb2.Timestamp(seconds=seconds_val, nanos=nanos_val)
time_interval = TimeInterval(end_time=end_time_proto)
except Exception as e_ts: logging.error(f"Writer: TIMESTAMP_ERROR for {metric_name_str}:
{e_ts}.", exc_info=True); return
labels = {}
# connection metrics
if metric_name_str == "equinix.fabric.connection.bandwidth_rx.usage":
labels["connection_uuid"] = subject_id
self._write_metric_point(METRIC_TYPES["connection_bw_rx_bps"], "DOUBLE",
metric_value, labels, time_interval)
self._write_metric_point(METRIC_TYPES["connection_bw_rx_mibps"], "DOUBLE",
metric_value / BITS_TO_MEBIBYTES, labels, time_interval)
elif metric_name_str == "equinix.fabric.connection.bandwidth_tx.usage":
labels["connection_uuid"] = subject_id
self._write_metric_point(METRIC_TYPES["connection_bw_tx_bps"], "DOUBLE",
metric_value, labels, time_interval)
self._write_metric_point(METRIC_TYPES["connection_bw_tx_mibps"], "DOUBLE",
metric_value / BITS_TO_MEBIBYTES, labels, time_interval)
elif metric_name_str ==
"equinix.fabric.connection.packets_dropped_rx_aside_rateexceeded.count":
labels["connection_uuid"] = subject_id
self._write_metric_point(METRIC_TYPES["connection_drop_rx_a"], "INT64",
metric_value, labels, time_interval)
elif metric_name_str ==
"equinix.fabric.connection.packets_dropped_tx_aside_rateexceeded.count":
labels["connection_uuid"] = subject_id
self._write_metric_point(METRIC_TYPES["connection_drop_tx_a"], "INT64",
metric_value, labels, time_interval)
elif metric_name_str ==
"equinix.fabric.connection.packets_dropped_rx_zside_rateexceeded.count":
labels["connection_uuid"] = subject_id
self._write_metric_point(METRIC_TYPES["connection_drop_rx_z"], "INT64",
metric_value, labels, time_interval)
elif metric_name_str ==
"equinix.fabric.connection.packets_dropped_tx_zside_rateexceeded.count":
labels["connection_uuid"] = subject_id
self._write_metric_point(METRIC_TYPES["connection_drop_tx_z"], "INT64",
metric_value, labels, time_interval)
# port metrics
elif metric_name_str == "equinix.fabric.port.bandwidth_rx.usage":
labels["port_uuid"] = subject_id
self._write_metric_point(METRIC_TYPES["port_bw_rx_bps"], "DOUBLE", metric_value,
labels, time_interval)
self._write_metric_point(METRIC_TYPES["port_bw_rx_mibps"], "DOUBLE", metric_value /
BITS_TO_MEBIBYTES, labels, time_interval)
elif metric_name_str == "equinix.fabric.port.bandwidth_tx.usage":
labels["port_uuid"] = subject_id
self._write_metric_point(METRIC_TYPES["port_bw_tx_bps"], "DOUBLE", metric_value,
labels, time_interval)
self._write_metric_point(METRIC_TYPES["port_bw_tx_mibps"], "DOUBLE", metric_value /
BITS_TO_MEBIBYTES, labels, time_interval)
elif metric_name_str == "equinix.fabric.port.packets_dropped_rx.count":
labels["port_uuid"] = subject_id
self._write_metric_point(METRIC_TYPES["port_drop_rx"], "INT64", metric_value,
labels, time_interval)
elif metric_name_str == "equinix.fabric.port.packets_dropped_tx.count":
labels["port_uuid"] = subject_id
self._write_metric_point(METRIC_TYPES["port_drop_tx"], "INT64", metric_value,
labels, time_interval)
elif metric_name_str == "equinix.fabric.port.packets_erred_rx.count":
labels["port_uuid"] = subject_id
self._write_metric_point(METRIC_TYPES["port_erred_rx"], "INT64", metric_value,
labels, time_interval)
elif metric_name_str == "equinix.fabric.port.packets_erred_tx.count":
labels["port_uuid"] = subject_id
self._write_metric_point(METRIC_TYPES["port_erred_tx"], "INT64", metric_value,
labels, time_interval)
else:
match = LATENCY_NAME_REGEX.match(metric_name_str)
if match:
source_metro = match.group(1).upper()
destination_metro = match.group(2).upper()
labels["source_metro"] = source_metro
labels["destination_metro"] = destination_metro
self._write_metric_point(METRIC_TYPES["latency"], "DOUBLE", metric_value,
labels, time_interval)
else:
logging.warning(f"Writer: Unknown metricname '{metric_name_str}'. Element:
{element}. Skipping.")
except Exception as e_outer:
logging.error(f"Writer: Outer error processing element {element}: {e_outer}",
exc_info=True)
def run(pipeline_flags, known_pipeline_args):
pipeline_options = PipelineOptions(flags=pipeline_flags, streaming=True, save_main_session=True)
with beam.Pipeline(options=pipeline_options) as pipeline:
(
pipeline
| 'ReadFromPubSub' >> beam.io.ReadFromPubSub(
topic=known_pipeline_args.input_topic
).with_output_types(bytes)
| 'ParseFlatMessage' >> beam.Map(parse_equinix_flat_message)
| 'FilterNoneParsed' >> beam.Filter(lambda x: x is not None)
| 'WriteAllMetrics' >> beam.ParDo(
WriteMetricsDoFn(project_id=known_pipeline_args.project_id)
)
)
if __name__ == '__main__':
logging.getLogger().setLevel(logging.INFO)
parser = argparse.ArgumentParser()
parser.add_argument('--input_topic', required=True, help='Pub/Sub input topic
(projects/<PROJECT>/topics/<TOPIC>)')
parser.add_argument('--project_id', required=True, help='GCP Project ID (needed for the
WriteMetricsDoFn)')
# For Dataflow standard options:
parser.add_argument('--project', help='GCP Project ID (for Dataflow runner - will be parsed by
PipelineOptions)')
parser.add_argument('--region', help='GCP Region for Dataflow job (will be parsed by
PipelineOptions)')
parser.add_argument('--temp_location', help='GCS path for temp files (will be parsed by
PipelineOptions)')
parser.add_argument('--staging_location', help='GCS path for staging files (will be parsed by
PipelineOptions)')
parser.add_argument('--job_name', help='Dataflow Job Name (will be parsed by PipelineOptions)')
parser.add_argument('--runner', default='DataflowRunner', help='Pipeline runner: DataflowRunner
or DirectRunner')
parser.add_argument('--worker_machine_type', default='n1-standard-1')
parser.add_argument('--max_num_workers', type=int, default=5)
parser.add_argument('--subnetwork', help='Dataflow worker subnetwork')
parser.add_argument('--no_use_public_ips', action='store_true', help='Disable public IPs for
workers')
parser.add_argument('--requirements_file', default='requirements.txt', help='Path to
requirements.txt')
parser.add_argument('--experiments', nargs='*', default=['use_runner_v2'], help='Dataflow
experiments')
known_pipeline_args, _ = parser.parse_known_args() # Custom args
# PipelineOptions will parse standard args from sys.argv if 'flags' is None or from the list.
run(None, known_pipeline_args) # Pass None to let PipelineOptions parse from sys.argv
logging.info("Equinix unified metric pipeline definition complete.")
6.3 Deploy the Dataflow Job
- Set Environment Variables
Note on Private IPs: Remember, using --no_use_public_ips on the next step requires that your specified --subnetwork has Private Google Access enabled.
Bash
export PROJECT_ID=$(gcloud config get-value project) # Or your preferred project id
export REGION="us-west2" # Or desired GCP Region for Dataflow
export BUCKET_NAME="equinix-metrics" # Or your preferred created bucket name
export TOPIC_ID="YOUR_TOPIC_ID" # Or your preferred created topic name
export INPUT_TOPIC_PATH="projects/${PROJECT_ID}/topics/${TOPIC_ID}"
export JOB_NAME="equinix-metrics-$(date +%Y%m%d-%H%M%S)" # Or your preferred job
name
export SUBNETWORK_PATH="regions/${REGION}/subnetworks/YOUR_SUBNETWORK"
# Your Subnetwork- Start the Dataflow Job using the python script
python3 pubsub_to_equinix_metrics.py \
--runner DataflowRunner \
--project ${PROJECT_ID} \
--region ${REGION} \
--temp_location gs://${BUCKET_NAME}/temp \
--staging_location gs://${BUCKET_NAME}/staging \
--input_topic ${INPUT_TOPIC_PATH} \
--project_id ${PROJECT_ID} \
--job_name ${JOB_NAME} \
--worker_machine_type n1-standard-1 \
--max_num_workers 5 \
--experiments=use_runner_v2 \
--subnetwork ${SUBNETWORK_PATH} \
--no_use_public_ips \
--requirements_file requirements.txt- Verify the Dataflow Job in the GCP Portal
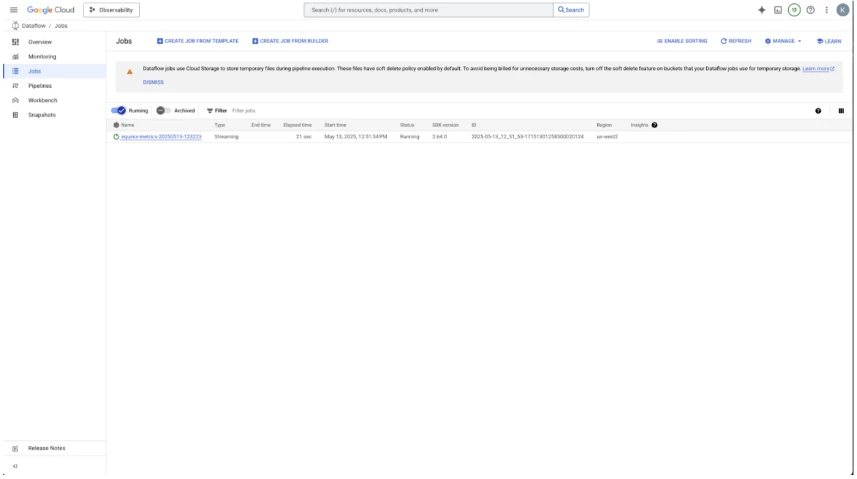
7. Test and Verify GCP Dataflow Job
7.1 Publish Test Data
Publish Test Data:
Use gcloud to publish test messages covering the different metric types (bandwidth usage, A-side drops, Z-side drops, A-side errors, Z-side errors, and metro latency) using the flat JSON format.
Connection Bandwidth RX (Example):
Bash
gcloud pubsub topics publish ${TOPIC_ID} --message \
"{\"message\":\"Metrics
collected\",\"resource\":{\"href\":\"https://api.equinix.com/fabric/v4/connections/a111a111- a111-a111-
a111- a111a111a111\",\"uuid\":\"a111a111- a111-a111-a111-
a111a111a111\",\"type\":\"IP_VC\"},\"metrics\":[{\"type\":\"SUM\",\"name\":\"equinix.fabric.connection.band
width_rx.usage\",\"unit\":\"packet\",\"interval\":\"PT5M\",\"datapoints\":[{\"endDateTime\":\"$(date -u +"%Y-
%m-%dT%H:%M:%S.000Z")\",\"value\":1234567.0}]}]}"
Ports Packet Dropped TX (Example):
Bash
gcloud pubsub topics publish ${TOPIC_ID} --message \
"{\"message\":\"Metrics collected\",\"resource\":{\"href\":\"https://api.equinix.com/fabric/v4/ports/a111a111-
a111-a111-a111- a111a111a111\",\"uuid\":\"a111a111- a111-a111-a111-a111a111a111\",\"type\":\"XF_PORT\"},\"metrics\":[{\"type\":\"SUM\",\"name\":\"equinix.fabric.port.packets
_dropped_tx.count\",\"unit\":\"packet\",\"interval\":\"PT5M\",\"datapoints\":[{\"endDateTime\":\"$(date -u
+"%Y-%m-%dT%H:%M:%S.000Z")\",\"value\":0}]}]}"
7.2 Troubleshoot with Dataflow Job using Worker Logs
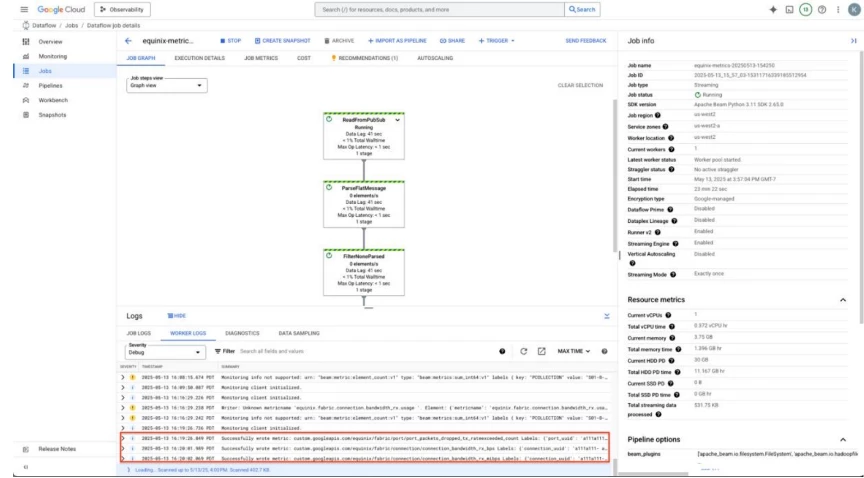
- Check dataflow Job: Monitor the Job in the Dataflow UI for successful execution and check worker logs for any errors or unexpected warnings. Look for "successfully wrote metric..." messages.
7.3 Check Cloud Monitoring for the Published Test Data
- Navigate to Monitoring ->Metrics explorer.
- Verify data points appear for all nine custom metric types (search for equinix/fabric).
- For each metric verify the values, timestamps, and labels.
- Values: Correct numeric values (bps, MiB/s, counts, ms).
- Timestamps: Match the time field from your messages.
- Labels:
- Bandwidth & Drop metrics: connection_uuid should be populated.
- Latency metric: source_metro and destination_metro should be populated.
8 Create Equinix GCP Pub/Sub Subscription
8.1 Create a Equinix GCP Pub/Sub Subscription
- Go to your service account and get the generated service account JSON
- Once the service account JSON is downloaded, use a tool like openssl to encode the json to base 64
Bash
openssl base64 -in <gcp_service_account>.json -out
<base_64_encoded_gcp_service_account>.json- Open the output file of the encoded base 64 service account JSON and use the subscription payload below (you may need to format and get rid of newlines):
curl -X POST 'https://api.equinix.com/fabric/v4/streams/<streamId>/subscriptions\
--header 'Content-Type: application/json' \
--header 'Authorization: Bearer <bearer_token>' \
--data '{
"type": "STREAM_SUBSCRIPTION",
"name": "<gcp_subscription_name>",
"description": "<gcp_subscription_desc>",
"sink": {
"uri":
"https://pubsub.googleapis.com/v1/projects/<gcp_project_id>/topics/<gcp_pub_sub_topic>:publish",
"type": "GOOGLE_PUBSUB",
"credential": {
"type": "ACCESS_TOKEN",
"apiKey": "<encoded_base64_gcp_service_account_json"
}
}
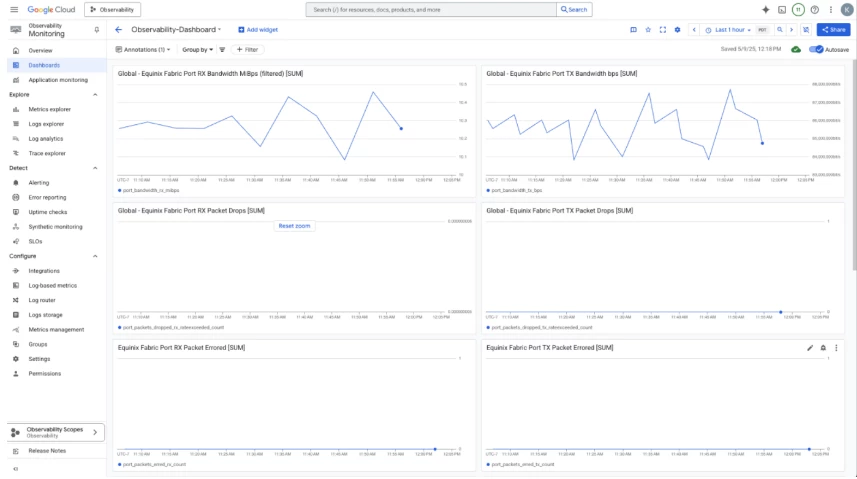
}'8.2 Create Cloud Monitoring Dashboard to View the Equinix Metrics
- Go to Cloud Monitoring
- Create New Dashboard
- Click Add Widget
- Find the Custom Metric or Search
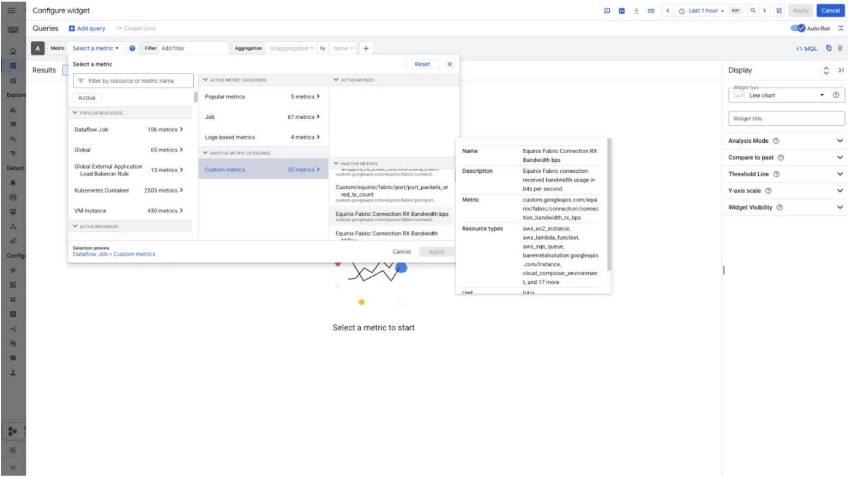
- Build out your dashboard to monitor the Equinix Metrics
| Disclaimer: These guides are unofficial and for general reference only. For specific details, please consult the respective provider’s documentation. |